Knowing
when to use which type of infographic is a beneficial skill to have because using the
right infographic will ensure that your readers will better understand your information. Infographics, when used correctly, are an excellent way to get people to read important content much faster.
Without further ado, here are seven types of infographics and when to use them:
1. List-based infographic
This type of infographic consists of content in a list format. A list-based infographic focuses on content that needs to be read in a specific order — for example, a list of steps that you need to follow to reach a certain end goal.
When to use it:
List-based infographics work best when you want your readers to take note of important content, but the format still allows them to skim through it. Readers have the option to only read the subheadings or to read all of the content for a deeper understanding. This will ensure that your readers have a great experience when reading this information, because it is clear and simple.
For example: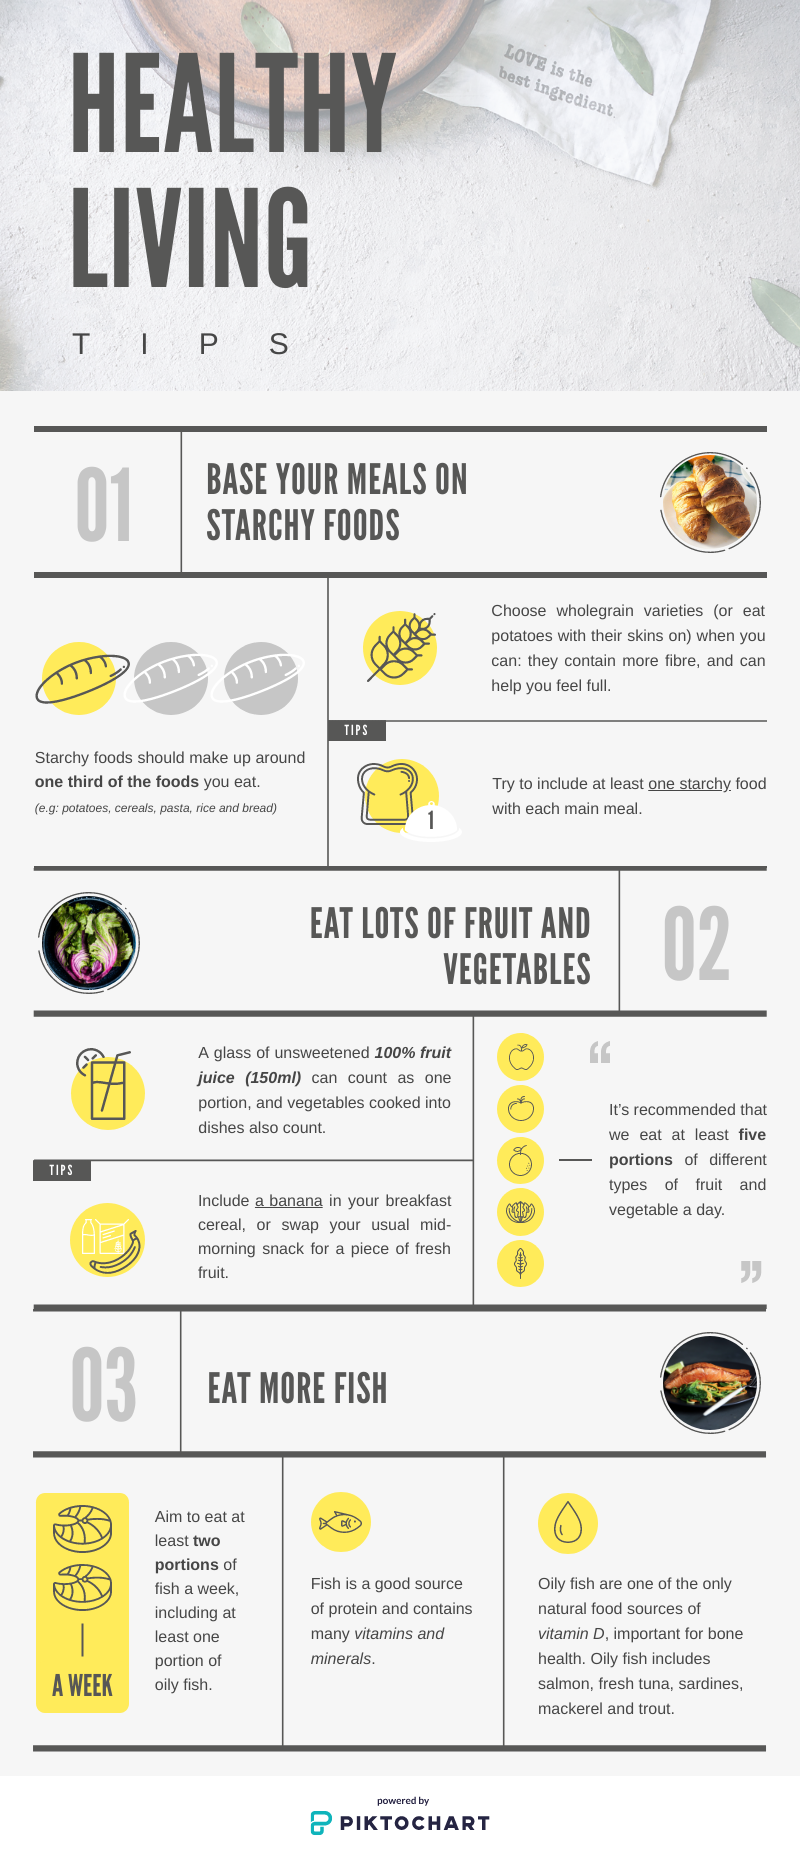
2. Comparison infographic
This type of infographic compares and contrasts two or more different topics. A comparison infographic allows the reader to see the pros and cons, or the similarities and differences, between the topics that are being compared to one another.
When to use it:The best time to make use of a comparison infographic is when a head-to-head study is done between two topics that are similar to one another. For example, you can use this infographic when deciding whether to adopt a pet or not or where to adopt a cat or dog.
For example: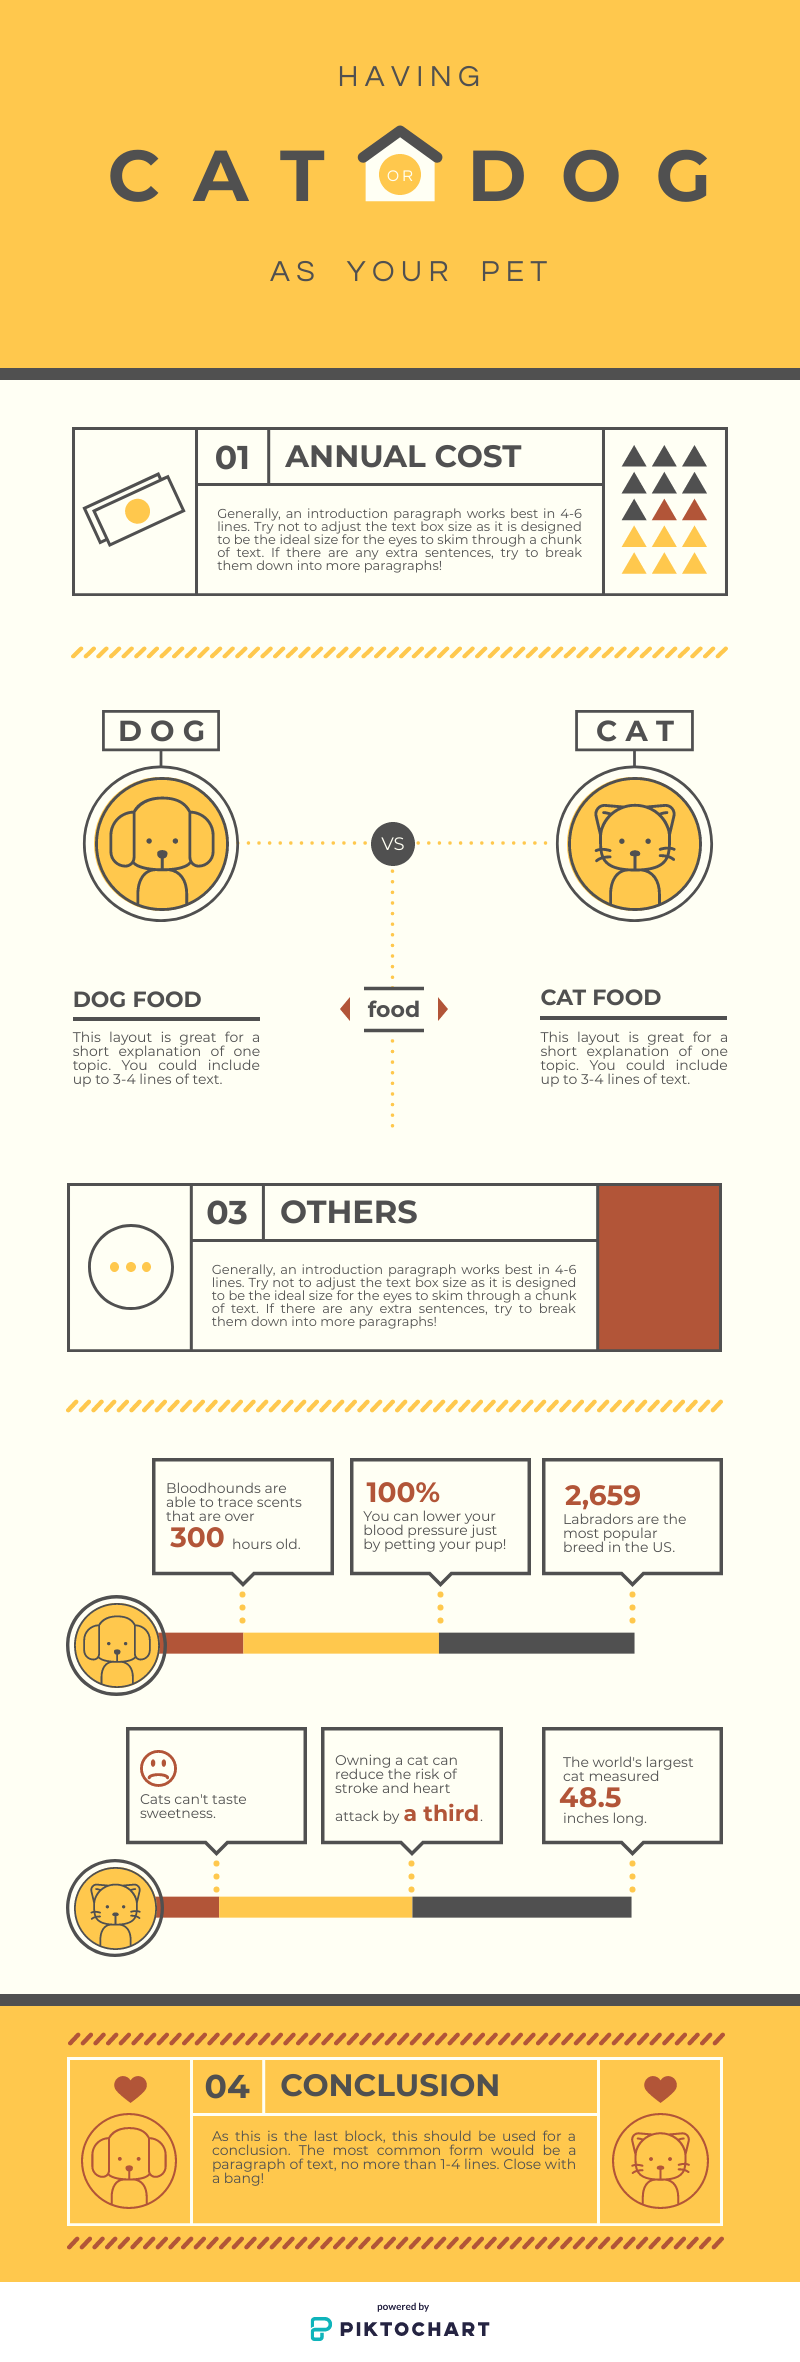
3. Visual article infographic
This infographic type allows a writer to make their article visual instead of relying on heavy text. A visual article infographic consists of a lot of visuals relevant to the content of the article. The approach makes it easier for the reader to work through the article instead of spending too much time reading the content.
When to use it:In an article done by Sliice, Catherine Oaks says: “According to a study done by Microsoft, the average human being has an attention span of eight seconds. Millennials now show an average attention span of eight seconds, beating the Gen Z that boasts one of 4 seconds.”
This type of infographic will work best when you have a text-heavy article; making it visual will ensure that you grab
and keep your reader's attention. Eye candy is what this infographic is all about!
For example: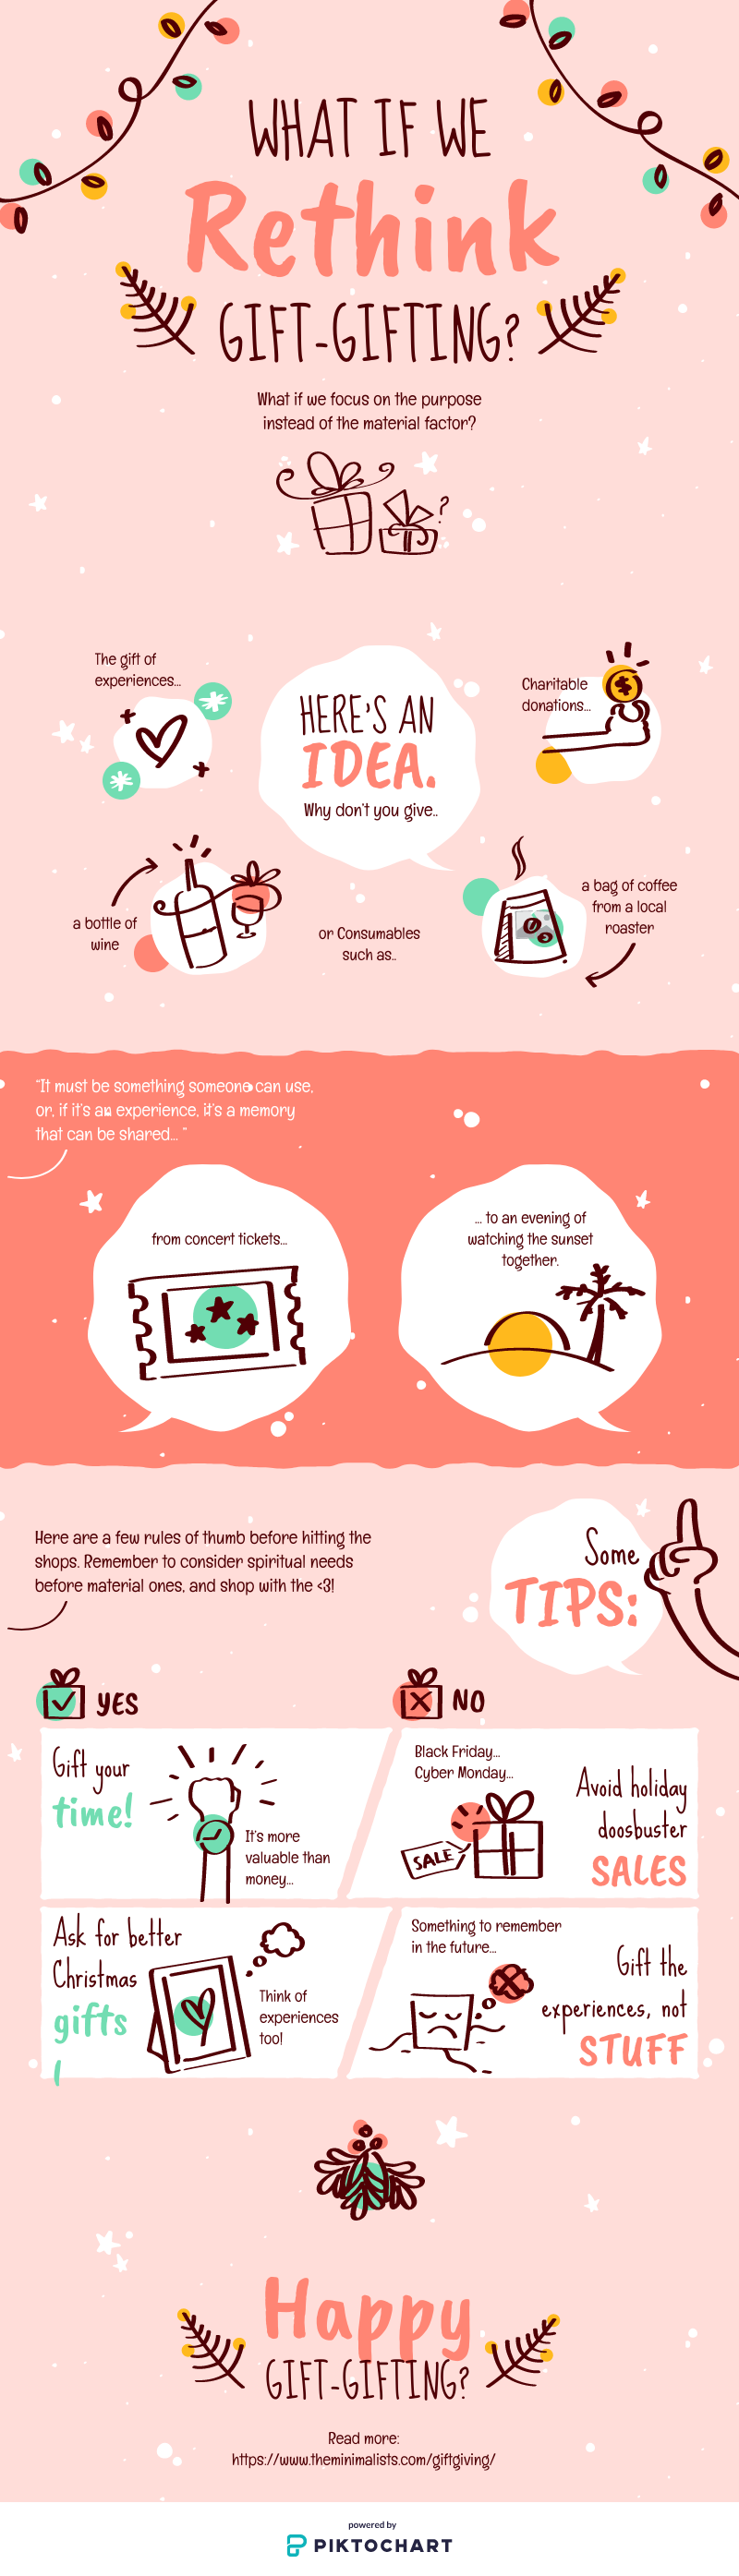
4. Interactive infographic
An interactive infographic consists of graphs and charts, while also adding in dynamic elements that can include pop-ups or questions. SnapApp created a great example of what an interactive infographic looks like.
Be sure to check it out — they combine charts, graphs and allow the user to engage with the actual infographic.
When to use it:An interactive infographic is best used when you want to attract a certain type of audience. The audiences that best respond to these types of infographics are creative thinkers, out-of-the-box doers and, of course, millenials and Gen-Z’s. These types of people have one thing in common — they enjoy
taking part instead of just sitting back.
Another great example of an interactive infographic is
The dude map: how Americans refer to their bros.
5. Data visualisation infographic
This type of infographic is when data is being displayed in charts or graphs. At times, looking at data on a piece of paper can seem boring or difficult to understand. By displaying data in a visual way, you allow your user to understand the information a
whole lot better and, at the same time, increase its effectiveness.
When to use it:When you have a ton of data on a certain topic, it would be beneficial to display the data in the form of a graph or chart. Not only will it be perceived easier by the reader, but it will also seem more exciting. When you want to talk about some important stats and keep the reader's attention, it will work
much better if you present it in a way that makes these stats stand out.
For example: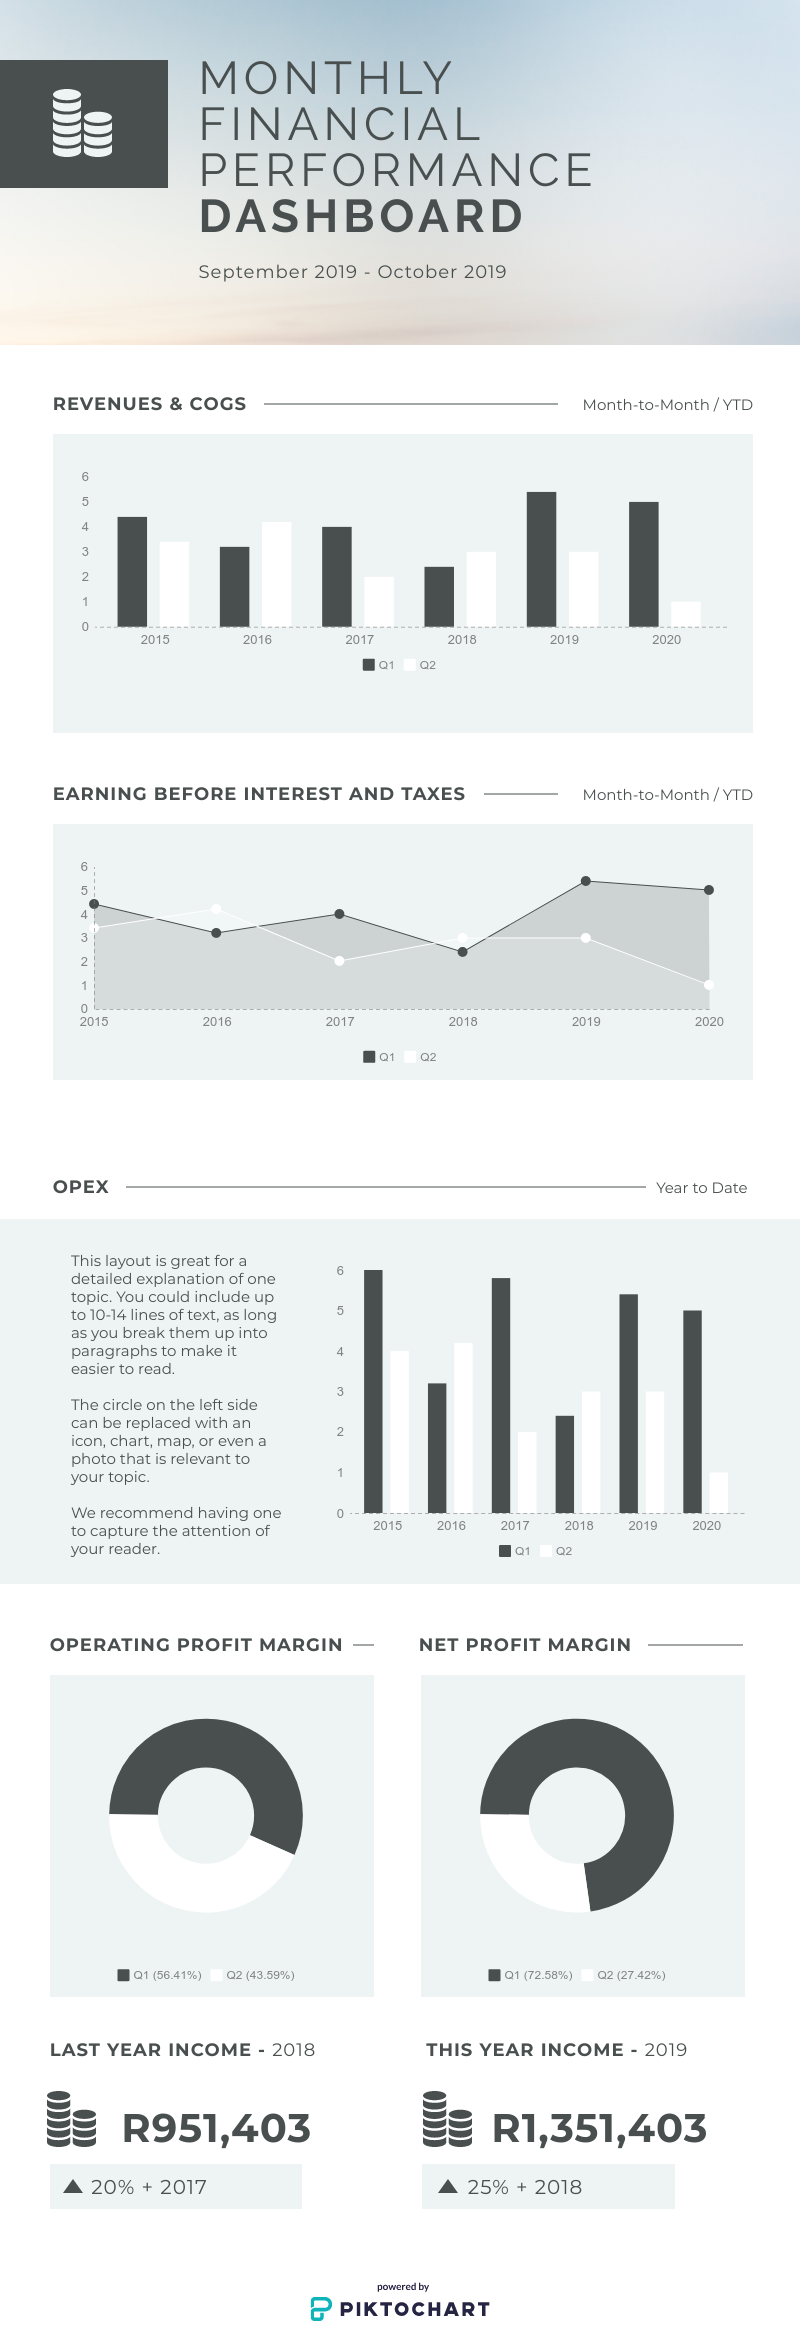
6. Timeline infographic
This type of infographic tells a story in chronological order. When you talk about the history of a brand and its products, it would be easier for the user to view a timeline and keep track of the things that took place in certain time periods.
When to use it:If you want to talk about where a brand began and how they managed to reach their success, it could be useful to tell the story in a timeline. If there are a lot of dates and content in the story, it will make it more appealing and easier to read for the user. Therefore, a timeline infographic is a great way to ensure that the user doesn’t confuse certain time periods with one another.
For example: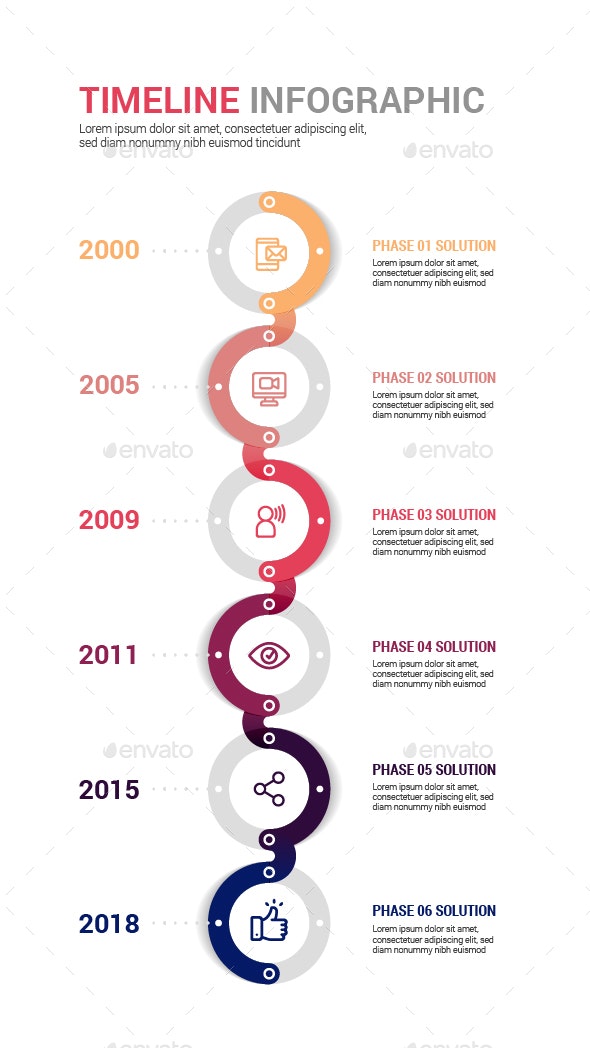
7. Visual resume infographic
A study done by TheLadders says: “Recruiters take an average of six seconds to scan a resume.” This means that you, as a jobseeker, only have six seconds to impress a person you have never met before. A visual resume infographic is an infographic that serves as your CV. This means that you add all of your relevant information on the infographic and make it look unique.
When to use it:If you want to
stand out from the rest of the job seekers out there, a visual resume is a
great way of doing just that. And don’t think that this type of resume will only work for graphic designers or markers because you can create a classy and professional resume that will work for any job application — from accounts to mechanics.
For example: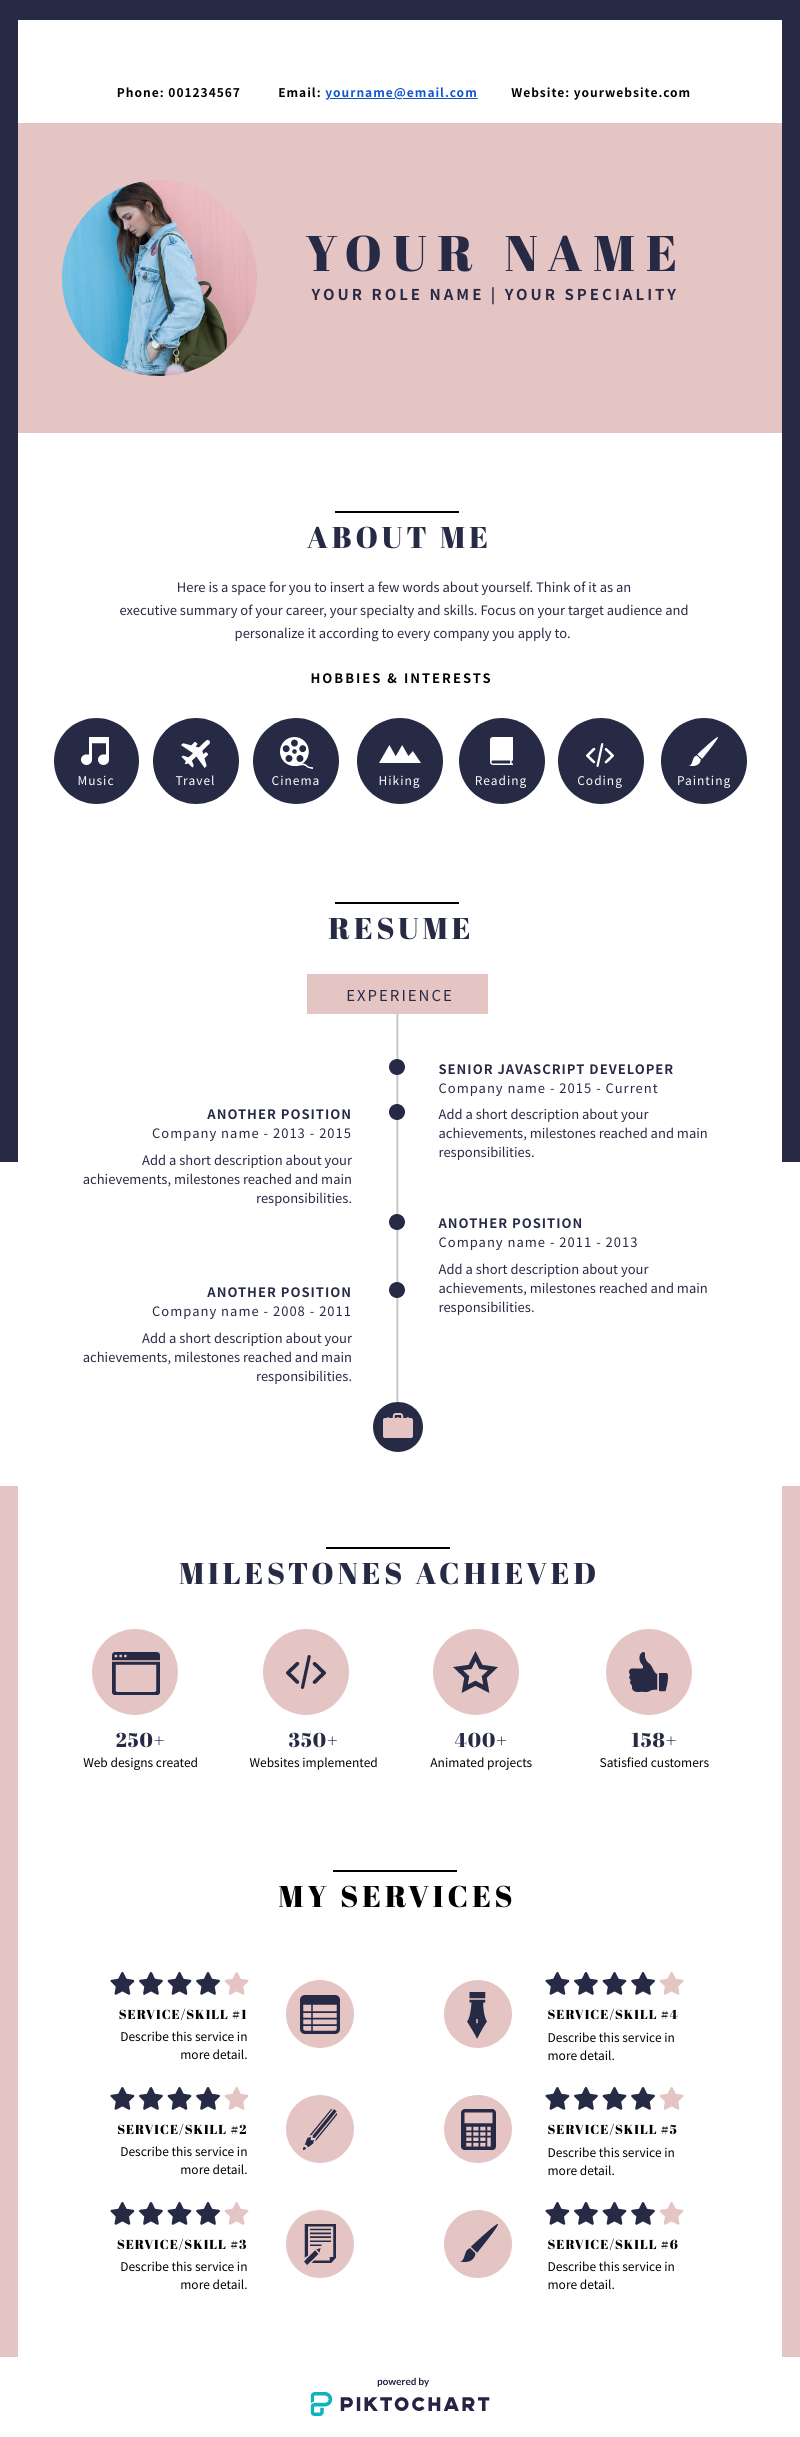 Do you enjoy making use of infographics? Let us know in the comments section below.
U lava mahungu aku hisa? Tsalela hina …
*Image courtesy of Vecteezy